
LogisticsSingapore: 
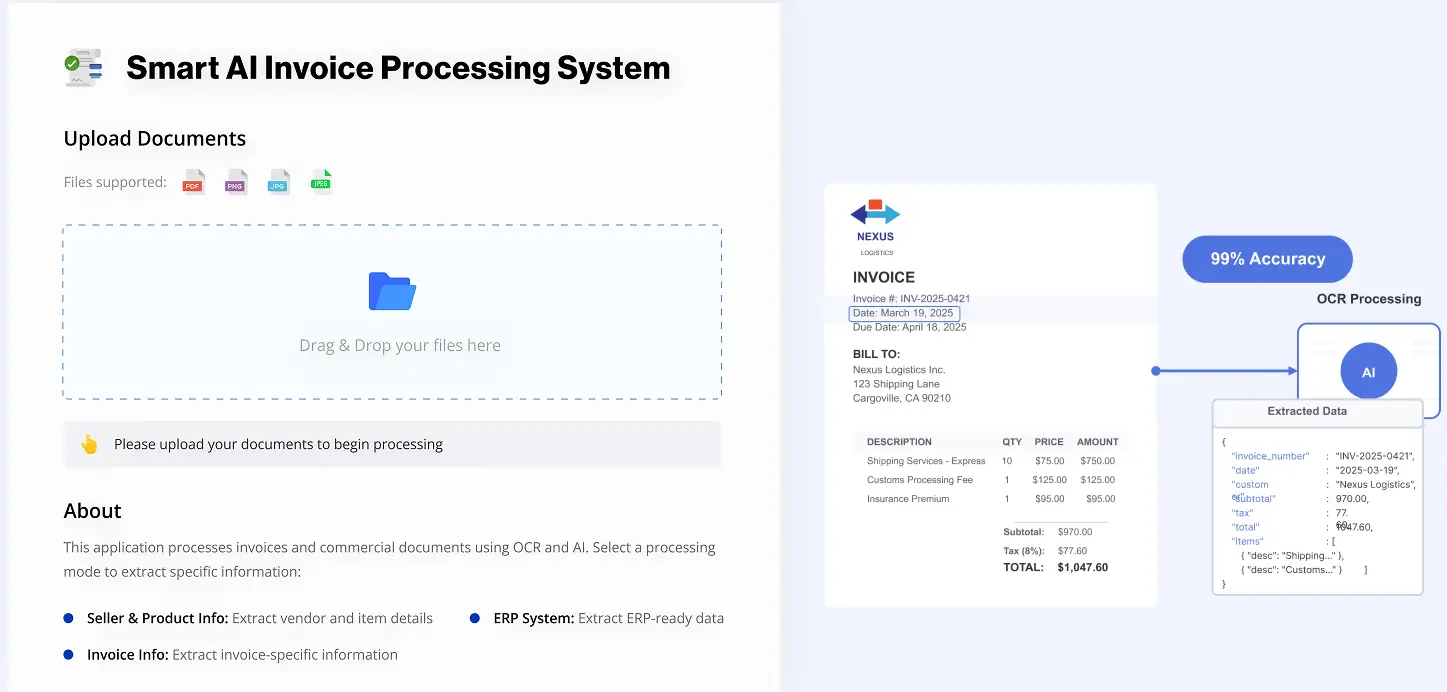
Smart AI Invoice Processing System
AI-powered invoice processing for a Singapore-based logistics enterprise. OCR and ML automate data extraction, validate against business rules, and process invoices end-to-end across multiple formats and currencies.
PythonLangGraphCrewaiStreamlitAzure